0 Comments
Google, finally succumbing to the siren call of drag and drop, has upgraded their entire Google Site setup. What was once a large, hard to use, unwieldy beast has turned into a familiar drag and drop website creation tool, much like Weebly (which is what this site was created on). Although the upgraded user interface has many benefits, some of the most important is the integration into Google Drive. We are all familiar with sharing documents, and collaborating through said documents, and Google has used that familiarity to make collaborating on a website just as easy. In addition, the integration with all of the other Google applications (Docs, Sheets, Calendars, Forms, Youtube...pick one!) is seamless with the new Google Sites. The end result is a website creation tool that is powerful enough to host a variety of information and media in a professional format, while being easy enough for students to create a fully functioning website in only a few class periods. The possibilities in the classroom are truly endless, from a tutorial/help website for a specific subject to a tourist website for a specific country they are researching. Any research project can easily be reworked to allow for a website creation component. Thanks again Google, and (finally) welcome to the web design of the 21st century! Numbers are hard. More specifically data can be overwhelming for adults and students alike, and often times the delivery of new information can lose its intended effect if it is too difficult to read. Luckily, infographics have been a movement towards communicating important ideas in an easy to understand format. More then just a bar graph or pie chart, infographics can be used to convey not just statistics, but visually display a variety of facts to easily digest. This directly relates to education, as infographics and digital posters are quickly taking the place of more traditional displays (i.e paper posters...no one will miss the glue sticks...). Depending on the format that you wish to create your digital poster or infographic in, this also gives students the ability to embed digital media, not just relying on worn out crayons and fancy scissors. Ultimately, this also forces students to reconsider what is important and how best to display information and statistics. We already ask for students to chose the best graph to represent data, this is simply the natural progression, asking students to chose the best way to display all information. There are a number of websites that streamline this process, allowing students to focus on what is most important...pictures of cats. To see this type of visualization of information in action, check out the video below.  There is no debate how important assessment is in education. Whether informal or formal, the chance for a student to demonstrate their learning is an important step in any classroom. However, as important as it is...students just don't ask for assessments! As strange as it is, the high stakes pressure cooker that is the traditional measuring stick for teachers just doesn't excite kids. Weird?! Kahoot looks to not only take the stress out of these important assessments, but also inject them with some friendly competition. A student can use a number of devices to reach your quiz, with the only output being 4 colorful buttons to click. 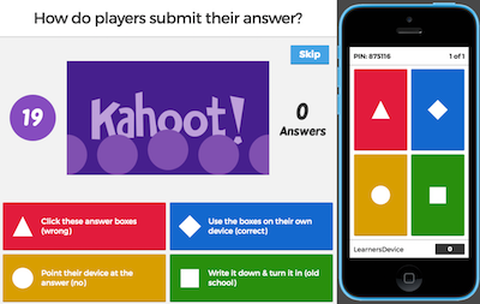 Please see the video below if you are interested in learning more on how to set up your very own Kahoot!! (note the double exclamation mark...one for the name...but another for emphasis!) |
Technology ManifestoTo give each student a platform that will elevate their thinking, problem solving, and knowledge. You don't have to change the world, just your mindset. Archives
January 2017
Categories |


 RSS Feed
